Plot Data
Plotting is for traces and computed factors visualization.
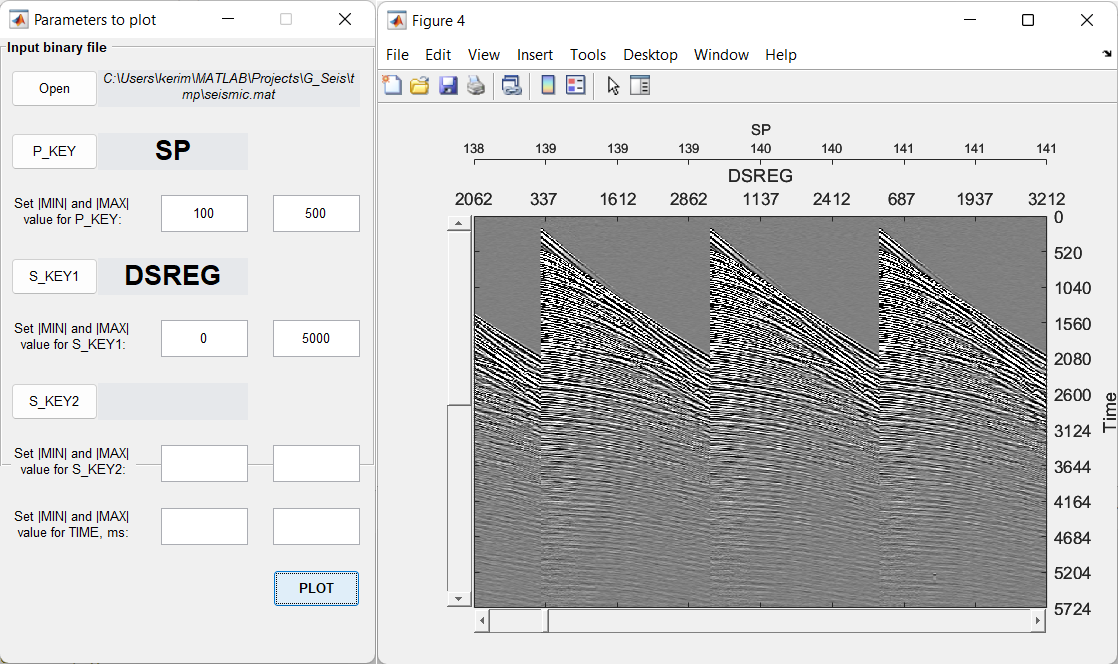
P_KEY - is primary key.
S_KEY1 and S_KEY2 - secondary keys.
Keys are needed to sort data before displaying.
Absolute values of MIN and MAX values are helpful to restrict the desired data.
In case of displaying factors only P_KEY is used wich should be set to SEQWL.
To display S (shot) factor for first layer choose MIN and MAX equal to 1. For the second layer use 11. For the third layer use 21.
To display R (receiver) factor for first layer choose MIN and MAX equal to 2. For the second layer use 12. For the third layer use 22.
To display M (offset) factor for first layer choose MIN and MAX equal to 3. For the second layer use 13. For the third layer use 23.
To display G (cdp) factor for first layer choose MIN and MAX equal to 4. For the second layer use 14. For the third layer use 24.
Note
Use Header Math module to view headers of computed factors.